Geo-Intel

Blog

How to use Market Share (step by step)

Want to know how much of the local customers a store would actually win - and how much your own stores steal from each other? This step-by-step guide walks you through the Market Share tool from the first click to the final report, with no jargon.

Step-by-stepBeginner friendlyNo jargon
June 26, 20269 min read

What the Market Share tool tells you

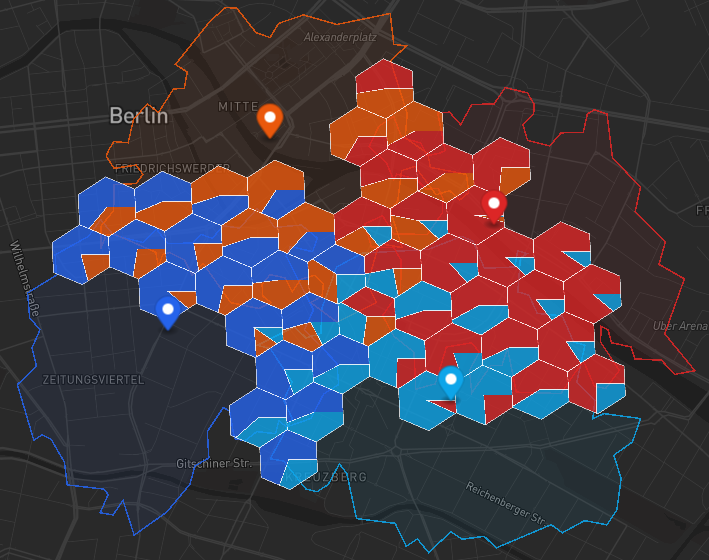
Imagine three pizza shops in the same part of town. Some customers live right next to one shop and will almost always pick it. Others live between two or three shops and could go to any of them. Market Share works out how those customers split up - how many each shop is likely to win, and how big each shop's slice of the whole pie is.

You use it to answer very practical questions: If I open here, how many customers will I realistically capture? How much will a competitor next door cost me? If I open a second store, will it bring in new customers or just steal from my first one? This guide walks you through it from the first click to the final report. No maps background needed - we explain every term as we go.

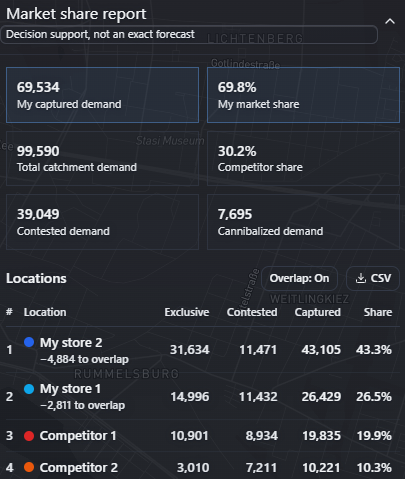
In plain English: “Decision support, not a forecast”

The numbers are an educated estimate to help you compare options and shortlist locations - not an exact prediction of next year's sales. Treat it as a smart first pass, then confirm with local knowledge.

1

Open the Market Share tool

At the top of the map there is a tool menu. Open it and choose Market Share. (The other modes are for general map exploration and area workflows; Market Share is the one that compares stores against competitors.)

Geo-Intel tool menu open with Explore, Territory, and Market Share options; Market Share is highlighted
Open the tool menu and pick Market Share to start comparing your stores against competitors.
2

Add your stores and your competitors

You work with two groups: My stores (the blue ones - yours) and Competitors (the red/orange ones). Add a location two ways: type an address into the search box, or click Add by clicking the map and drop a pin. You can rename any location and drag its pin to move it.

Each location also has an Attractiveness number. Leave it at 1 if all the stores are roughly equal. Make it bigger for a location that pulls more strongly - a larger floor area, a flagship, a stronger brand.

In plain English: Attractiveness

A simple “pulling power” dial. A store set to 2 is treated as twice as appealing as a store set to 1, so it wins a bigger share of the customers they compete over.

Geo-Intel Market Share panel showing My stores and Competitors groups, each with two locations and an attractiveness field
Add at least one of your own stores, plus any competitors. Each pin has a name, an attractiveness dial, and its own catchment.
3

Draw a catchment for each store

A catchment (also called a trade area) is the area a store can realistically serve. You set one rule that applies to every store - for example, “5 minutes by bike” or “2 km by car” - and Geo-Intel draws the matching zone around each pin. Pick a travel mode (driving, walking, cycling), choose whether to measure by time or distance, set the value, then press Generate catchments.

In plain English: Catchment / isochrone

An isochrone is just “everywhere you can reach in X minutes.” A 5-minute driving catchment is the blob of streets you could drive to in 5 minutes from the store - that blob is the store's trade area.

Market share is only contested where these zones overlap. The parts of a catchment no competitor reaches are captured outright; the overlap is where the real competition happens.

Catchment settings card with travel mode, time or distance toggle, a travel-time slider, and a Generate catchments button
One catchment rule applies to every store. Here: a 5-minute cycling trade area. Move a store and its catchment rebuilds.
4

Optional: shape who counts as “demand”

By default, demand just means the number of people living in an area - everyone counts equally. But maybe you only care about a certain kind of customer. In the Demand profile section you can tilt the demand toward the people you want - for example, higher-income households or a particular age group.

Tick a characteristic and choose a direction: Cluster (high) means “I want more of this” and Gap (low) means “I want less of this.” If you skip this step, every resident is simply weighted the same - which is perfectly fine.

In plain English: Demand profile

A way to say “not all customers are equal to me.” It gently boosts the areas full of your ideal customers so the market-share split reflects the people you actually want.

Demand profile card with a population checkbox, a weight slider, Cluster and Gap direction buttons, and demographic options
Optional: weight demand toward your ideal customer (e.g. a target age or income), instead of treating every resident the same.
5

Choose how distance is measured

When customers sit between several stores, what decides which one is “closer”? You pick the method:

  • Straight line - the simple “as the crow flies” distance. It is instant and free, and good enough for a first look.
  • Route - the real travel time along actual roads. More realistic (rivers, motorways, and one-way streets all matter), so it is the better choice for a final decision.

In plain English: Why distance matters

The tool assumes people lean toward the store that is easier to reach. “Straight line” treats a store across a river as close; “Route” knows you have to drive to the bridge first.

Distance method card offering Straight line or Route, with travel mode and fastest or shortest options for route mode
Straight line is fast and free; Route uses real road travel time for a more realistic split.
6

Optional: fine-tune the model

Under Customize model parameters there are two dials. You can ignore them and the defaults work well - but here is what they do, in plain terms:

  • Attractiveness enhancement (α) - how much a store's size/strength matters. Turn it up and the “big” stores pull even harder.
  • Distance decay (β) - how quickly people give up as a store gets farther away. Turn it up and customers stick much more strongly to their nearest store.

Right below is the Own-network overlap switch. Leave it On for the realistic picture (your nearby stores share the customers they both reach). Flip it Off to see how each of your stores would do as if it were the only one - which reveals how much overlap your own network is creating.

In plain English: The Huff model (what’s doing the math)

All of this feeds a well-known rule called the Huff gravity model: like gravity, a bigger and closer store exerts more “pull,” so it wins a larger share of the customers that several stores compete over. You never do the math - the tool does.

Model parameters card with Attractiveness enhancement (alpha) and Distance decay (beta) sliders, plus an own-network overlap toggle
Two optional dials: how much store strength matters (α) and how fast distance puts people off (β). Defaults are sensible.

Press Calculate

When your stores have catchments, hit Calculate market share. Nothing runs until you ask it to (Route mode in particular uses a paid map service, so the tool never surprises you). Change anything afterwards and a Recalculate prompt appears.

Tip: start with Straight line to explore for free, then switch to Route for the final answer.

7

Read the market share report

This is the payoff. The boxes at the top are the headline numbers, and the table lists every store from biggest winner to smallest. Here is what each number means:

  • My captured demand & My market share - how many customers your stores win in total, and that as a percentage of everyone in the analysis.
  • Total catchment demand - all the customers across every store's trade area. Competitor share is the slice the competition takes.
  • Contested demand - customers in the overlap who had to be split. Cannibalized demand - the customers your own stores took from each other.

In the table, each store shows Exclusive (customers only it reaches), Contested (its share of the overlap), Captured (the two added together), and Share (%). The Overlap: On/Off button and the CSV export sit right above the table.

Final market-share analysis map with overlapping catchments and pie-split contested hexes for four locations in Berlin
Final analysis map: each contested hex is split by the share each location captures, with colored catchment outlines for context.
Market share report showing captured demand, market share, competitor share, contested and cannibalized demand, and a ranked table of stores
The report: headline numbers up top, then every store ranked by captured demand with its exclusive, contested, and share figures.
8

See who lives in the contested area

Finally, the tool profiles the people in the overlap - the customers everyone is fighting over. You get a quick read on population, density, average age, the share of foreign nationals, nearby points of interest, and more. It is the same demographic snapshot used elsewhere in Geo-Intel, focused on the battleground.

That helps you sanity-check the result: if the contested customers don't look like the people you want, you might reposition a store, shrink the catchment, or shape demand back in Step 4.

Contested-area demographics panel showing population, area, density, average age, foreign nationals, points of interest, and built volume
A profile of the people in the contested overlap - so you can check the customers you're competing for are the ones you actually want.

Every term, in one place

Bookmark this if a word ever trips you up.

Catchment (trade area)
The area a store can realistically serve - everywhere within, say, a 10-minute drive.
Demand
The customers in an area. By default this is the number of people who live there.
Exclusive demand
Customers only one store can reach. That store captures all of them.
Contested demand
Customers who could visit two or more stores, so the stores have to share them.
Captured demand
The total a store wins: its exclusive customers plus its share of the contested ones.
Market share
Your captured demand as a percentage of all the demand in the analysis.
Cannibalization
Demand your own stores take from each other when they sit too close together.
Huff model
A simple rule of thumb: a closer, bigger, or stronger store wins a larger share of shared customers.

The whole workflow, in six lines

  • Open the tool menu and choose Market Share.
  • Add your stores (blue) and competitors (red/orange).
  • Draw a catchment - a drive-time or distance trade area - for each store.
  • Pick how distance is measured: Straight line for free, or Route for realistic travel time.
  • Optionally shape demand and fine-tune the model, then press Calculate.
  • Read the report: your captured demand, market share, contested overlap, and cannibalization.

Remember: Market Share is a fast, transparent estimate to help you compare and shortlist - a smart starting point, not a guaranteed sales figure.

Quick questions

How do I start a market share analysis?

Open the Market Share tool, add at least one of your own stores plus any competitors, draw a catchment (a drive-time or distance zone) for each, then click Calculate market share to see the report.

What is a catchment or trade area?

A catchment - also called a trade area - is the area a store can realistically serve. Geo-Intel draws it as an isochrone: everywhere you can reach within, say, a 10-minute drive of that store.

What does contested demand mean?

Contested demand is the customers who live where two or more catchments overlap. They could realistically visit several stores, so the tool splits them between those stores using the Huff model.

What is store cannibalization?

Cannibalization is the demand your own stores take from each other when their catchments overlap. The report shows this so you can place new locations that add coverage instead of competing with yourself.

Is the market share number a sales forecast?

No. It is decision support for comparing locations and planning a network, not an exact sales prediction. It estimates the relative pull of each store from attractiveness, travel distance, and nearby demand.

See it on a real map

Open the Market Share workflow and try the same analysis steps on your own locations.