Demand
Foot-traffic drivers like eateries, venues, and points of interest that pull people in.
Open data, transparent scoring, zero friction
How it works
Geo-Intel turns messy local data into a single map you can actually defend. Build your view, tune it live, and inspect every score down to the signal.
Start from any supported city. The map loads a clean H3 hex grid ready to score.
Add the things that matter: foot-traffic drivers, competitors, demographics, and transit.
Slide each signal up or down and flip its direction. The map re-scores instantly.
Inspect any hex for a full, explainable breakdown. No black boxes, no guesswork.
Four signal axes
Every hex combines four independent signal families into a single composite. You decide how much each one counts - and you can see exactly how it adds up.
Learn more about scoringFoot-traffic drivers like eateries, venues, and points of interest that pull people in.
Existing businesses and building subtypes - cluster with them or hunt for the gaps.
Who actually lives there, from Zensus 2022 (DE) and NHGIS 2020 (US) census data.
Transit stops and connectivity that decide how easily people can reach a spot.
Hex labels show weight × percentile rank (0-100) within each 7-hex cluster—not raw measurements. The composite is their sum at each position.
Stacking signal layers
Weighted composite (Σ wᵢ × percentile)
Rendered in the live map's Viridis ramp
Each pᵢ is this hex's percentile rank (0-100) on that axis (relative to the map area)—not a raw measurement.
+0.06×82 −0.90×10 +0.02×71 +0.02×63=88.6
Territory mapping & drive-time catchments
Geo-Intel turns any address or map click into a real territory - a drive-time, walk-time, cycling, or distance catchment (isochrone), or a polygon you draw yourself. Map sales territories, franchise areas, delivery zones, and store catchments, then compare reach, population and age, demographics, income and affluence, points of interest, and building volume across every area, spot exactly where they overlap, and open a full demographic dashboard for each one. Free, in your browser, with no signup.
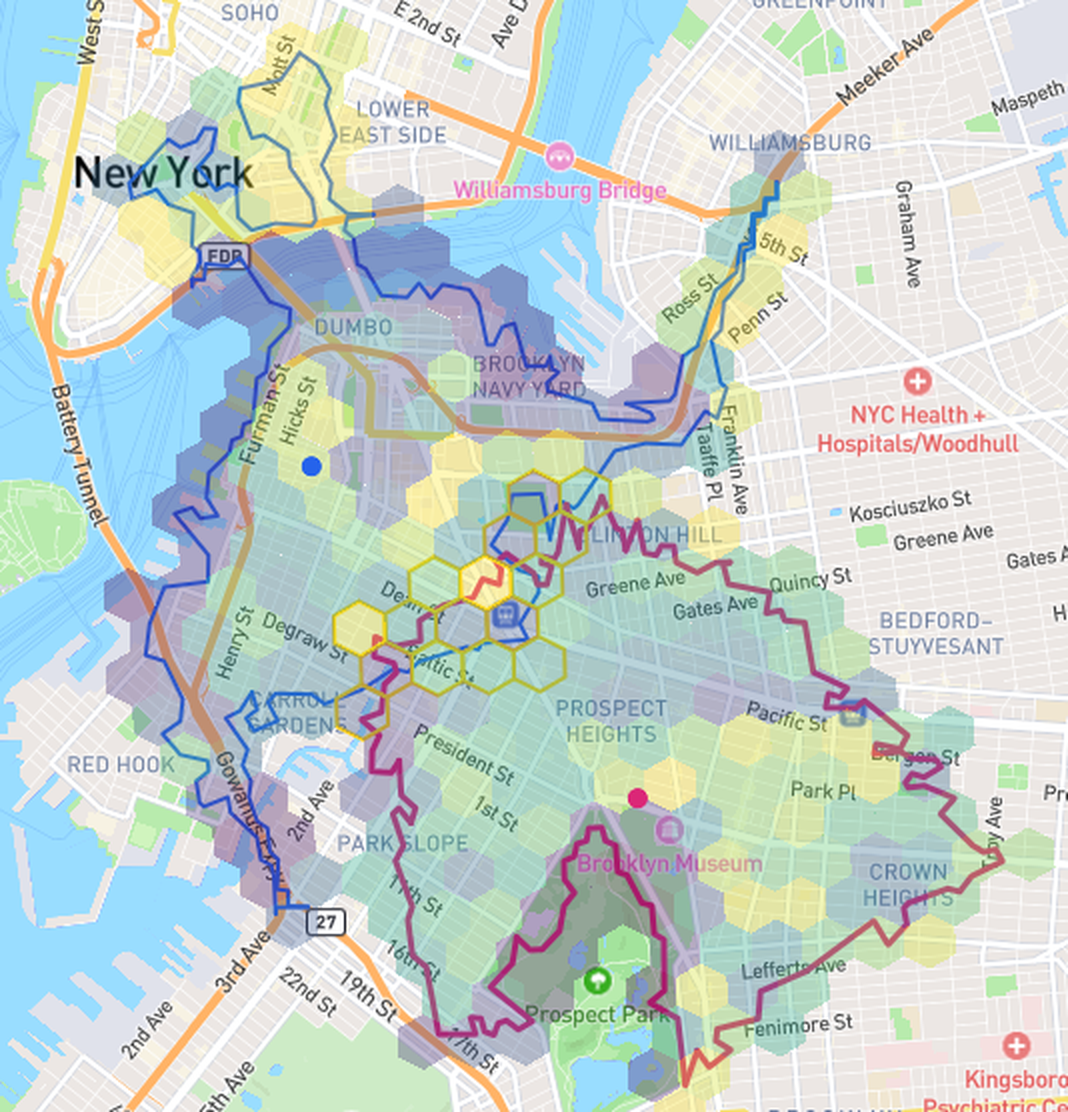
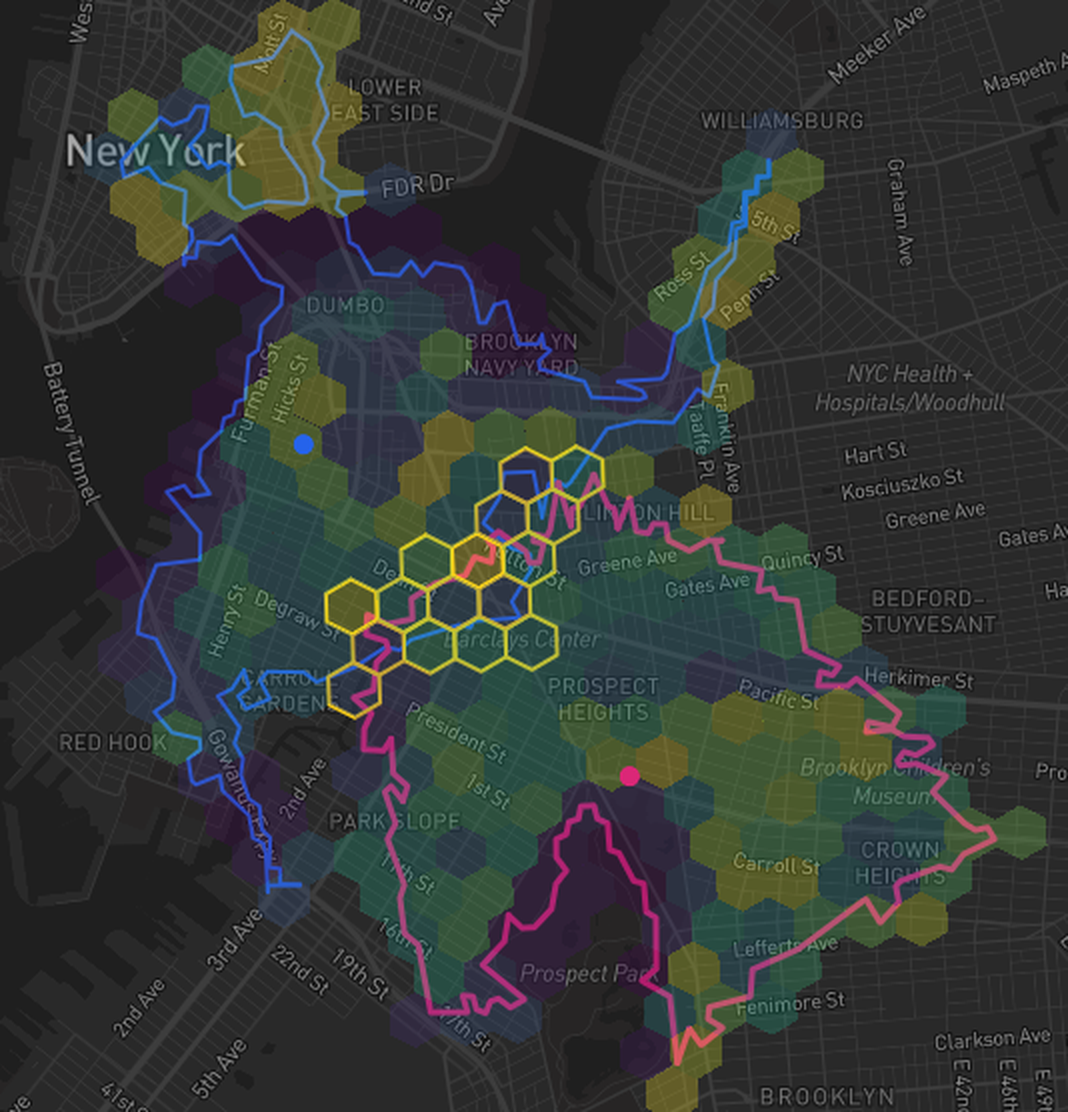
Build a territory from any address or map click, then size it by driving, walking, or cycling time - or a fixed distance radius. Draw freehand polygons when you need an exact boundary.
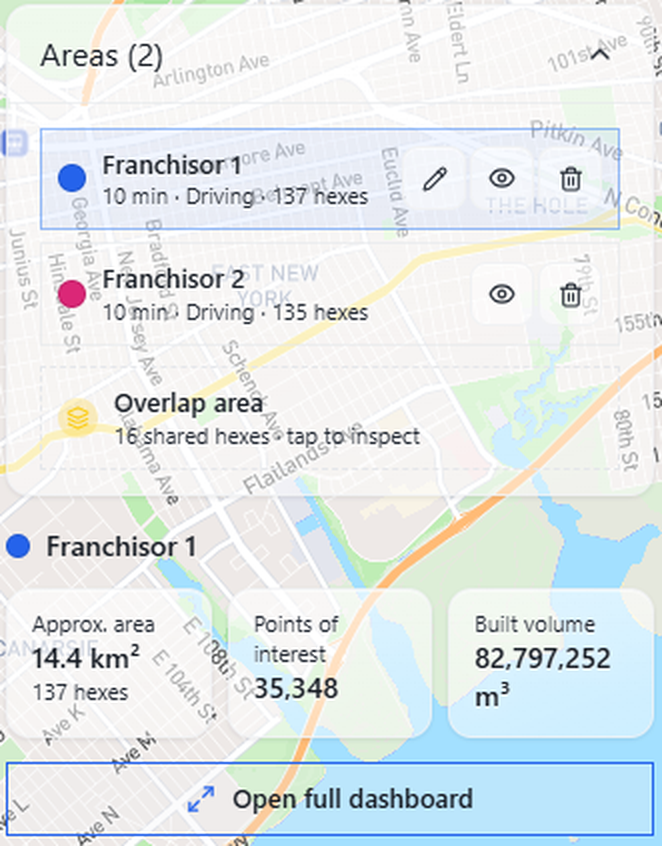
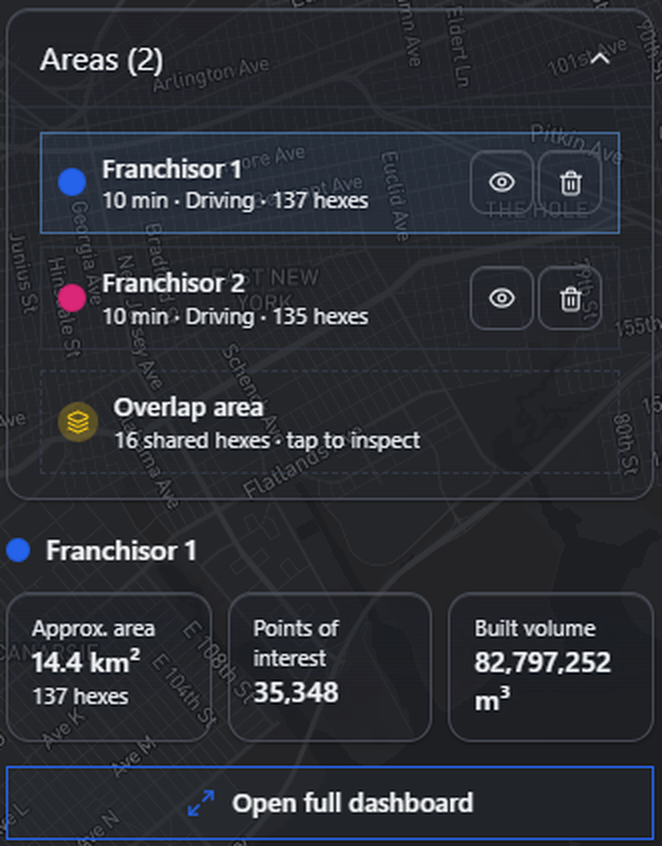
Add as many areas as you need - franchisees, sales reps, stores, or branches - and compare population, reach, and points of interest across every territory at a glance.
Instantly see where two territories overlap and where coverage gaps remain, so you can balance territories fairly, prevent conflict, and avoid cannibalizing your own locations.
Every territory ships with a live breakdown - population and age, points of interest, built volume, demographics, and accessibility - built from open data, with no spreadsheets.
Define territories from any address - driving, walking, cycling, or distance. No signup, no sales call.
Market share & trade-area analysis
Drop your own stores and competitors on the map, draw a trade-area catchment for each, and Geo-Intel estimates how local demand splits between you and the competition. Using the Huff gravity model, it turns store attractiveness, travel distance or drive time, and a demand profile you build from the data catalog - population, demographics, age, income and affluence, spending power, nearby points of interest, and building volume - into captured demand, market share, contested overlap, and cannibalization - explained for every location, not hidden in a black box.
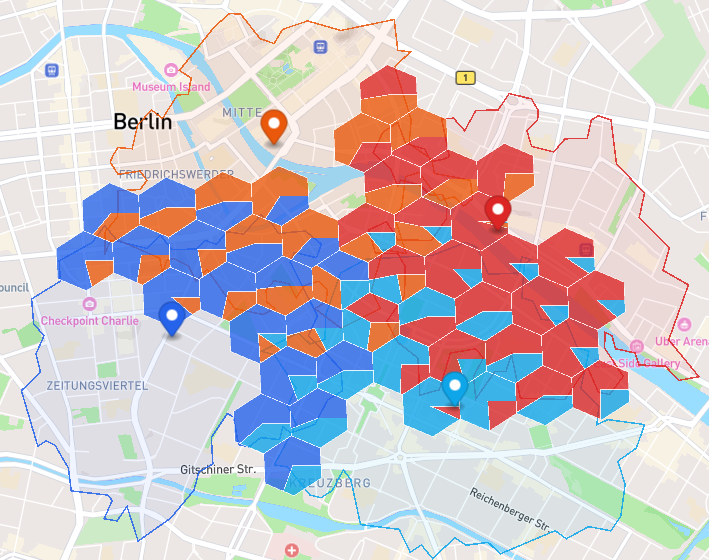
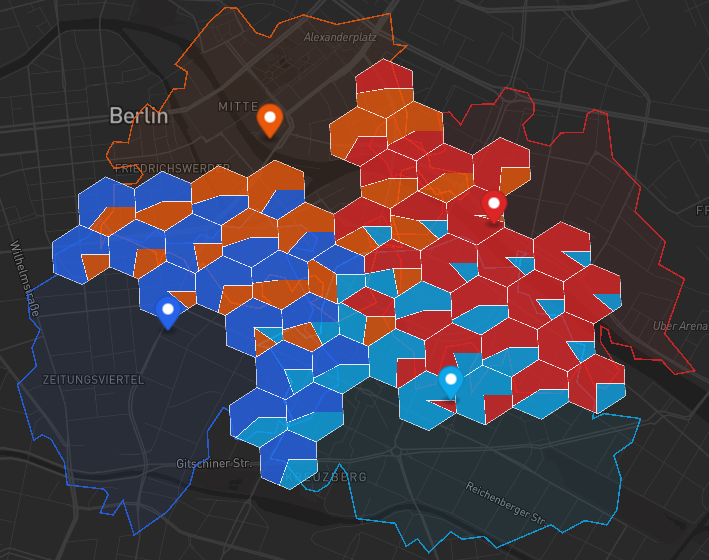
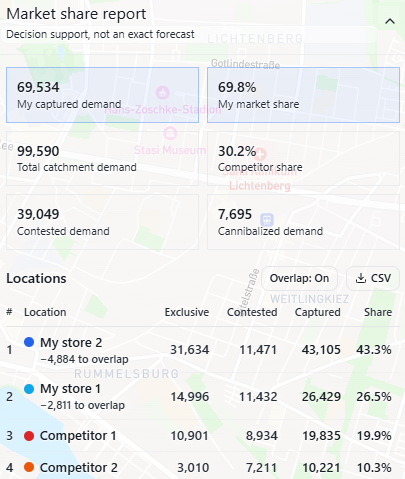
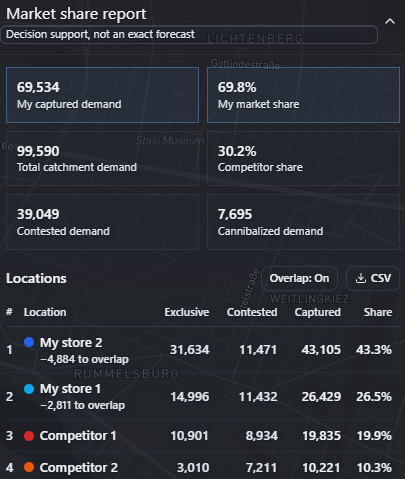
See the total demand inside your catchments and the exact share your network wins versus every competitor location.
Where catchments overlap, demand is contested. A Huff gravity model splits it by store attractiveness and travel distance, hex by hex.
Measure the demand your own stores pull from each other, so you can plan a network that grows coverage instead of overlapping it.
Rank every location, export to CSV, and see who lives in the contested area. Open data, transparent math, no signup.
Decision support for site selection and network planning - not an exact sales forecast.
Why Geo-Intel
Most location tools hand you a number and ask you to believe it. Geo-Intel shows its work, lets you steer, and keeps everything self-serve.
Every hex score is broken down by signal. No black boxes, no hidden weights - just numbers you can trace.
Adjust weights and directions and watch the map re-score live. Test a dozen scenarios in minutes.
Draw a bounding box or polygon to rank only within your target zone, so the score fits your search.
Blend demand, competition, demographics, and accessibility into one composite view of any neighborhood.
Use cases
Whether you run a business or just live your life, the same transparent map turns a tough call into a decision you can stand behind.
Compare micro-locations for demand, competition, and accessibility before committing to a lease.
Learn moreScreen walkability, transit, and neighborhood character before signing a lease or relocating.
Learn moreFind areas with the right venue density and foot traffic for a pop-up, bar crawl, or community night.
Learn moreMatch neighborhood demographics to your audience to decide where to advertise or hand out flyers.
Learn moreFAQ
Territory mapping and market-share analysis questions.
It is a territory mapping tool for drawing and comparing service areas on a map. Pick any address or click the map, then build a territory as a drive-time, walk-time, cycling, or distance catchment (isochrone), or draw a polygon by hand. Use it to map sales territories, franchise areas, delivery zones, and store catchments, then compare population, reach, and points of interest across every area.
Search for an address or click a location on the map, choose a travel mode (driving, walking, or cycling) and a time or distance limit, and Geo-Intel instantly draws the catchment as an H3 hex area. Repeat for each store, rep, or franchisee to build a full set of territories you can rename, recolor, and edit.
Yes. Add as many territories as you need and Geo-Intel compares their size, population, and points of interest side by side. Where two or more territories cover the same area, the shared hexes are highlighted as an overlap area you can tap to inspect - ideal for balancing franchise territories fairly and avoiding conflict or cannibalization.
Every territory comes with an instant dashboard built from open data: approximate area and hex count, total population and age structure, points of interest, built volume, demographics, and accessibility. Click the overlap area to see the same breakdown for just the contested zone.
It is a trade-area market-share tool: you place your own stores and competitors on the map, draw a catchment (drive-time or distance) for each, and Geo-Intel estimates how much of the local demand your network captures versus the competition - reported as captured demand, market share, contested demand, and cannibalization per location.
It uses the Huff gravity model. Inside the area where catchments overlap, each unit of demand is split between the competing stores in proportion to their attractiveness and inversely to travel distance or drive time, so closer and stronger locations capture more. Sole-coverage area outside any overlap is captured outright.
A catchment (trade area) is the area a store can realistically serve, drawn as a drive-time or distance isochrone. Where two or more catchments cover the same place, that demand is contested and shared between the stores. Demand that only one catchment reaches is exclusive and captured fully by that store.
Yes. When your own stores sit close together, their catchments overlap and split the same customers. Geo-Intel reports the cannibalized demand your network loses to its own overlap, so you can space new locations to add coverage rather than compete with yourself.
No. It is decision support for site selection and network planning, not an exact sales forecast. The Huff model shows the relative pull of locations given attractiveness, distance, and demand - ideal for comparing options and shortlisting sites, then confirming with local knowledge.
Product, data, coverage, and everyday-use questions.
Yes. Geo-Intel is free to use with no credit card, no trial clock, and no paywall. Every neighborhood score and map layer on the site is available at no cost.
No. Geo-Intel is fully self-serve, so you can open the map and start analyzing locations instantly without a signup, login, or sales call.
Anyone making a location decision: small business owners, renters, event planners, marketers, and researchers. Business and everyday use cases are examples, not restrictions.
It blends four signal axes - demand, competition, demographics, and accessibility - across a 100-meter H3 hex grid, then shows a transparent per-signal breakdown for every hex so nothing is a black box.
Yes. You can tune the weight and direction of each signal in real time and watch the map update live, so the score reflects your own decision criteria rather than a fixed formula.
Enterprise site-selection suites are powerful but gated behind demos, licenses, and multi-thousand-dollar contracts. Geo-Intel gives independent users transparent neighborhood scoring for free, with no signup.
Compare candidate neighborhoods on demand, competitor saturation, and accessibility before signing a lease, then weight the signals that matter most to your concept to shortlist the best blocks.
It highlights areas with strong surrounding demand but relatively low saturation of your business category - the gaps where a new location is most likely to be underserved by competitors.
Yes. Renters and movers use it to screen neighborhoods for walkability, transit access, nearby amenities, and local demographics before committing to a lease or a move.
Yes. Event planners find areas with the right venue density and foot traffic, while marketers match neighborhood demographics to a target audience to decide where to advertise or hand out flyers.
It aggregates open Overture Maps building and POI data with optional public demographic enrichments - Zensus 2022 in Germany and NHGIS 2020 in the US - processed into H3 hex grids.
Coverage currently spans dozens of major US cities and many major German cities - including Berlin, Munich, Hamburg, Cologne, and Frankfurt - and the catalog keeps expanding as new cities are processed.
Yes. You can draw a bounding box or polygon, or pick an administrative boundary, so scoring and ranking only consider the zone you care about.
Geo-Intel is a transparent, fast first-pass built on public data, so it is best for directional comparison and shortlisting. Confirm a final decision with on-the-ground visits and any required legal or financial checks.
There is nothing to hand over: Geo-Intel needs no account or personal details, and analysis runs on public geospatial datasets rather than your information.
No. The homepage shows a locked Berlin preview; the complete scoring app with full filters, area drawing, and all available cities lives at /app.
Free forever
Open the full interactive map and start analyzing neighborhoods in seconds. No signup, no credit card, no sales call.
Launch the full map