Geo-Intel

Blog

How to use Territory Mapping (step by step)

Want to draw a sales territory, franchise area, or store catchment and instantly see how many people, shops, and buildings are inside - and where two areas overlap? This guide walks you through Territory Mapping from the first click to the full dashboard, with no jargon.

Step-by-stepBeginner friendlyNo jargon
June 26, 20268 min read

What Territory Mapping tells you

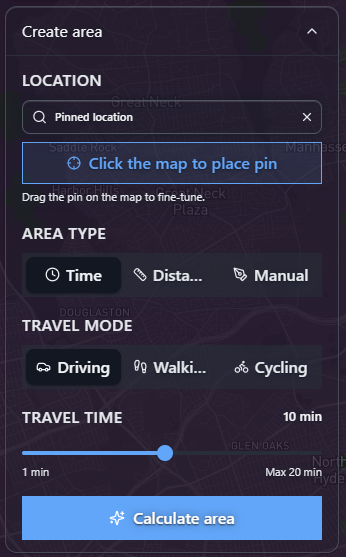
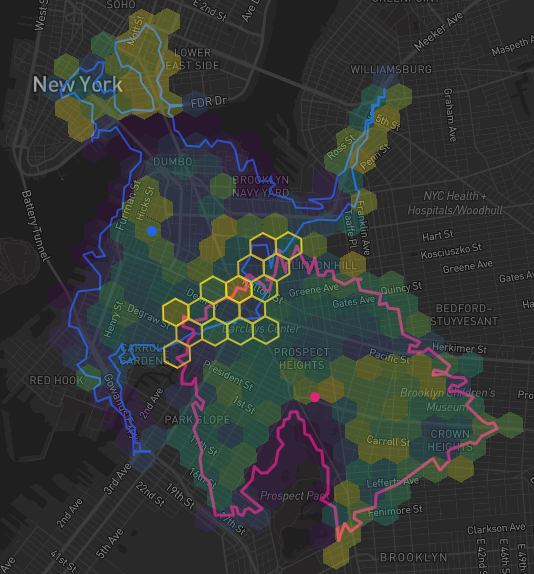
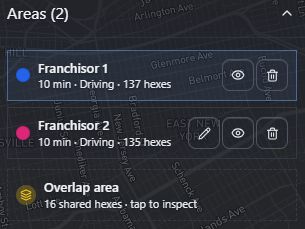
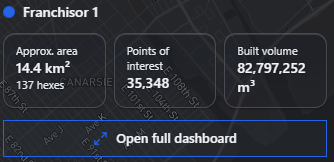
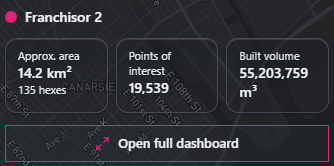
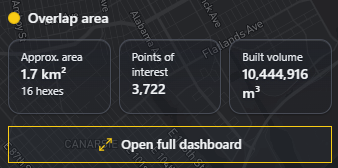
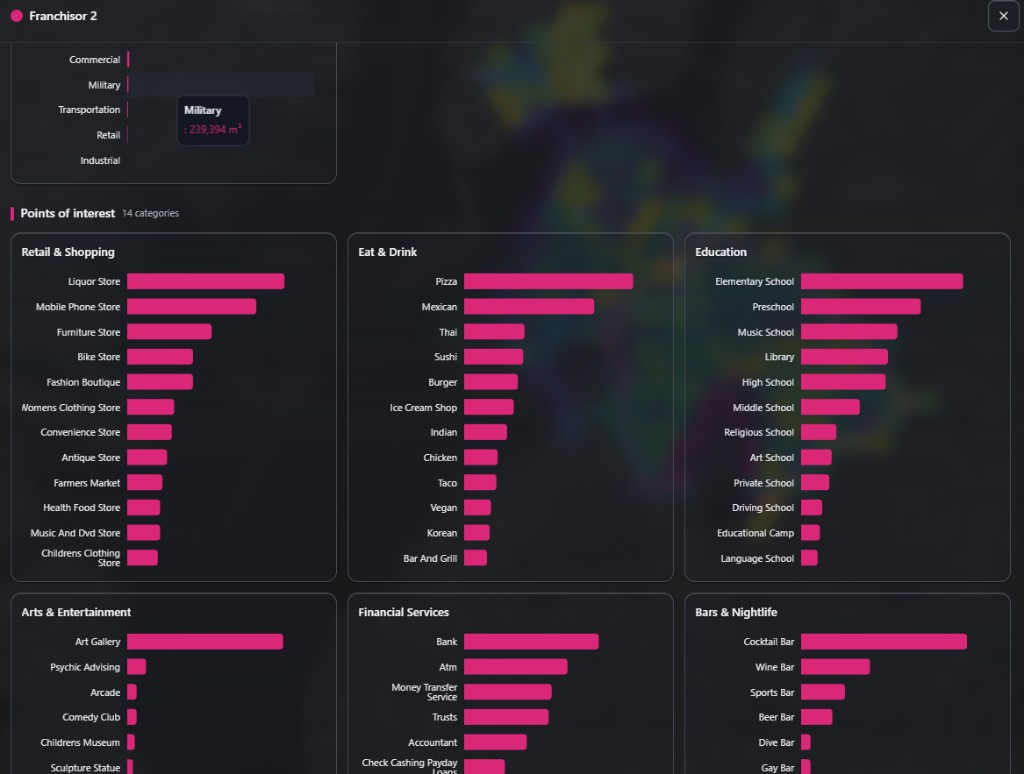
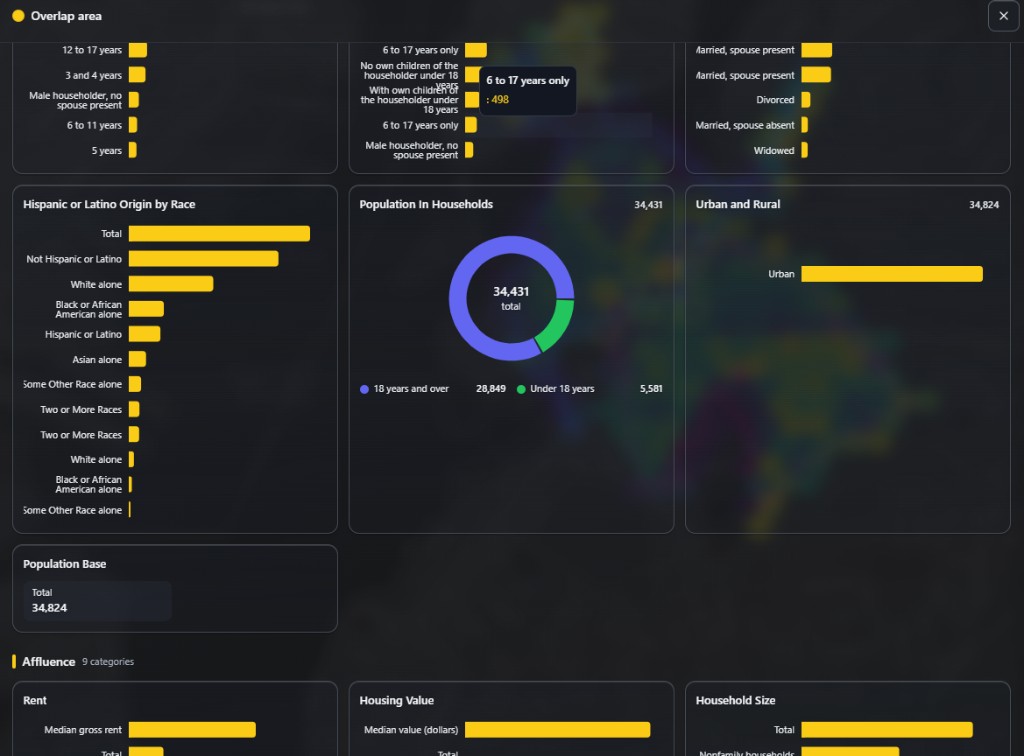
A territory is just a zone you draw on a map - the area around a shop, office, or branch that you care about. Territory Mapping lets you draw those zones in seconds and instantly see what is inside each one: how many people live there, how many shops and schools and restaurants there are, and how built-up it is. Draw a second zone and it also shows you exactly where the two overlap.

People use it to answer everyday business questions: Which neighborhoods does my store actually reach? How should I split a city fairly between two franchisees or sales reps? Do my two branches step on each other's toes? Which area has the most potential customers? This guide walks you through it from the first click to the full dashboard. No maps background needed - we explain every term as we go.

In plain English: “A smart first look, built on open data”

Territory Mapping is fast and transparent, built on free public map and census data. It is ideal for comparing areas and planning coverage - then confirm the final call with local knowledge.

1

Open the Territory tool

At the top of the map there is a tool menu. Open it and choose Territory. You can also jump straight in with the deep link geointel.cc/app?tool=territory. This is the mode for drawing and comparing areas (the other modes are for general map exploration and market-share analysis).

2

Pick a location for your first area

Every territory starts from a point on the map - the center of the zone you want to study. There are two easy ways to set it: type an address into the Location search box, or click Click the map to place pin and tap anywhere on the map. Once the pin is down you can drag it to fine-tune the exact spot.

In plain English: The pin

The pin is simply “here is the place I'm interested in” - your shop, a candidate location, a competitor, or any address. Everything else is measured outward from this point.

Create area panel with a location search box, a Click the map to place pin button, area type options Time, Distance and Manual, travel mode options Driving, Walking and Cycling, a travel-time slider set to 10 minutes, and a Calculate area button
The Create area panel: set a location, choose how to size the area, then press Calculate area.
3

Choose how the area is drawn

Now you decide the shape and size of the territory. There are three Area type options:

  • Time - everywhere you can reach within a number of minutes (a drive-time area). For example, “10 minutes by car.”
  • Distance - everywhere within a set distance along the roads, e.g. “2 km.”
  • Manual - draw the boundary yourself by clicking points on the map, when you want an exact custom shape.

For Time and Distance, also pick a Travel mode - Driving, Walking, or Cycling - then drag the slider to set the value (the panel shows the maximum allowed). Finally, press Calculate area and Geo-Intel draws the zone around your pin.

In plain English: Drive-time area (isochrone)

A 10-minute driving area is the blob of streets you could actually drive to in 10 minutes from the pin. It hugs real roads, rivers, and bridges - so it is far more realistic than drawing a plain circle on the map. The technical word for it is an isochrone.

4

Add more areas and see them on the map

Repeat Steps 2-3 to add as many territories as you need - one per shop, branch, franchisee, or sales rep. Each gets its own color. On the map, every territory is drawn as a set of small hexes (six-sided tiles) with a colored outline. Where two territories cover the same tiles, that shared ground is highlighted as the overlap area.

In plain English: Why hexes?

The map is divided into thousands of equal six-sided tiles. Counting people and places tile by tile means every area - no matter its shape - can be measured and compared on exactly the same footing. You never have to think about them; they just make the numbers trustworthy.

Map of New York City showing two drive-time territories drawn as hex areas with blue and pink outlines, and the hexes shared by both highlighted in gold as the overlap area
Two 10-minute driving territories across New York City. The gold hexes in the middle are the overlap - the ground both areas share.
5

Manage and compare your areas

The Areas panel lists every territory you have drawn. Each row shows its name, color, and a quick summary - here, “10 min · Driving · 137 hexes.” Use the row buttons to rename, recolor, show/hide, edit, or delete an area. When two areas overlap, an Overlap area row appears with the number of shared hexes - tap it to inspect that shared zone on its own.

Areas panel listing Franchisor 1 and Franchisor 2 - each with travel time, mode and hex count and buttons to edit, show or hide, and delete - plus an Overlap area row showing 16 shared hexes with a tap to inspect hint
The Areas panel: compare every territory at a glance, and tap the Overlap area to study the ground two areas share.
6

Read the headline numbers for each area

Select any territory and you get its three headline numbers right away - no setup required:

  • Approx. area - the size of the zone in square kilometres (and how many hexes it covers).
  • Points of interest - how many named places (shops, food, schools, and so on) sit inside.
  • Built volume - the total amount of building in the area, a quick gauge of how busy and developed it is.

Because every area is measured the same way, you can compare them directly. In the example below, the first territory holds far more points of interest (35,348) than the second (19,539), while the overlap they fight over is a small but dense slice of the city.

Summary card for the first territory showing approximate area 14.4 square kilometres over 137 hexes, 35,348 points of interest, and built volume 82,797,252 cubic metres
Territory 1: 14.4 km², 35,348 points of interest.
Summary card for the second territory showing approximate area 14.2 square kilometres over 135 hexes, 19,539 points of interest, and built volume 55,203,759 cubic metres
Territory 2: 14.2 km², 19,539 points of interest.
Summary card for the overlap area showing approximate area 1.7 square kilometres over 16 hexes, 3,722 points of interest, and built volume 10,444,916 cubic metres
Overlap: a small 1.7 km² zone the two areas share.
7

Open the full dashboard for any area

Want the full picture? Press Open full dashboard on any territory. This opens a rich breakdown built from open census and map data, including a Points of interest section that groups every place into easy categories - Retail & Shopping, Eat & Drink, Education, Arts & Entertainment, Financial Services, Bars & Nightlife, and more - with the most common types ranked inside each group. There is also a building-volume breakdown by type (residential, commercial, retail, and so on).

In plain English: Why the categories help

Instead of one big number, you see what kind of place an area is. Lots of bars and restaurants suggests nightlife and footfall; lots of schools and family stores suggests a residential, family neighborhood. That tells you whether an area fits what you are looking for.

Full territory dashboard showing a building-volume-by-type chart and a points-of-interest section with categories Retail and Shopping, Eat and Drink, Education, Arts and Entertainment, Financial Services, and Bars and Nightlife, each listing ranked place types
The full dashboard: points of interest grouped into clear categories, with the most common types ranked in each - so you can tell at a glance what kind of area it is.
8

Inspect the overlap (shared) area

Finally, tap the Overlap area to study just the ground two territories share. You get the same full dashboard, focused only on the contested zone: total population and age split, household and family makeup, an Affluence section (rent, home value, household size), and the local population mix. It is the perfect way to check the area both sides are competing for - or to make sure two territories are not doubling up on the same customers.

If the shared area is bigger or more valuable than you expected, you might move a pin, shrink a travel time, or redraw a boundary so each territory covers its own patch more cleanly.

Overlap area dashboard showing age breakdowns, a population-in-households donut chart with 34,431 total split into adults and under-18s, urban and rural split, Hispanic or Latino origin by race bars, a population base of 34,824, and the start of an Affluence section with rent, housing value, and household size
The overlap dashboard: population, age, household makeup, and affluence for the exact zone two territories share.

Every term, in one place

Bookmark this if a word ever trips you up.

Territory (area)
A zone you draw on the map around a place, so you can study everyone and everything inside it.
Catchment / trade area
The area a shop or branch can realistically reach or serve - the customers it can pull in.
Isochrone (drive-time area)
Everywhere you can reach within a set time, e.g. a 10-minute drive. It follows real roads, not a plain circle.
Isodistance (distance area)
Everywhere within a set distance, e.g. 2 km, measured along the road network.
Hex
The map is split into small, equal six-sided tiles. Geo-Intel counts people and places tile by tile, so areas are easy to add up and compare.
Points of interest (POI)
Named places on the map - shops, restaurants, schools, banks, bars, and so on.
Built volume
The total size of all buildings in an area, in cubic metres - a quick gauge of how built-up it is.
Overlap area
The tiles that belong to two or more of your territories at the same time - the ground they share.

The whole workflow, in six lines

  • Open the tool menu and choose Territory (or go to /app?tool=territory).
  • Pick a location: search an address or click the map to drop a pin.
  • Choose how to size it - travel time, distance, or a shape you draw - then press Calculate area.
  • Add more areas; the map highlights where any two of them overlap.
  • Compare the headline numbers - area, points of interest, and built volume - for each one.
  • Open the full dashboard for any area, and tap the overlap to inspect the shared zone.

Remember: Territory Mapping is a fast, transparent way to compare areas and plan coverage - a smart starting point built on open data, not the final word.

Ready to try it? Open Territory Mapping and draw your first area in under a minute.

Quick questions

How do I create a territory?

Open the Territory tool, pick a location by searching an address or clicking the map, choose how to size the area (a travel time, a distance, or a shape you draw), then press Calculate area. Geo-Intel draws the territory instantly.

What is a drive-time area or isochrone?

An isochrone is everywhere you can reach within a set time - for example, a 10-minute drive from a shop. Geo-Intel draws that reachable zone as your territory, so it follows real roads instead of a plain circle.

Can I compare more than one territory?

Yes. Add as many areas as you like and the Areas panel lists each one with its size, points of interest, and building volume, so you can compare them side by side and rename, recolor, hide, or delete any of them.

What is the overlap area?

When two territories cover some of the same ground, those shared map tiles are the overlap area. You can tap it to inspect exactly who and what sits in the zone both areas share - useful for spotting conflict or double coverage.

What does each territory dashboard show?

Every area opens a full dashboard built from open data: total population and age, household and affluence figures, points of interest grouped by category (shops, food, schools, nightlife, and more), and total building volume.

See it on a real map

Open Territory Mapping and draw your own areas - compare them, find the overlap, and open the full dashboard for each.